Can BiSSE find the gene that drives speciation?
A gene that changes how fast its lineage diversifies, and the standard test that is
supposed to detect it, scored on data where the truth is known. All the relevant files are
in analyses/bisse/.
The question
A genomic key innovation is a gene whose possession changes how fast a lineage diversifies. The standard tool for detecting that pattern is state-dependent diversification: BiSSE fits a model in which a binary character sets the speciation and extinction rates, and a likelihood-ratio test asks whether the rates really differ by state. On real data the character is often a gene's presence or absence. Does the test find a gene that truly drives speciation, and does it stay quiet on one that does not?
Why real data cannot answer it
On a real clade nobody knows whether the gene drives diversification; that is the question being asked. Worse, a gene can be common among surviving species for reasons that have nothing to do with selection on the gene, and on real data you cannot hold those reasons fixed. A simulated dataset can, because the simulator knows which gene drives and by how much, and can plant a second gene, identical in every rate, that drives nothing.
The run
One joint run grows the species tree and the genome together: a driver family, present
at the root and lost per copy at rate 0.12, multiplies the speciation rate by a factor
f while it is present.
from zombi2 import genomes, joint, species
from zombi2.params import PerLineage

result = joint.simulate(
    species.birth_death(
        birth=PerLineage(1.0).scaled_by("genomes:driver",
                                        {"present": 3.0, "absent": 1.0}),
        death=0.3, n_extant=150),
    genomes.genome(duplication=0.0, loss=0.12, origination=0.0,
                   families=[genomes.family("driver"), genomes.family("control")]),
    seed=1)
We grew 200 replicate clades to 150 extant tips at each of six factors, f = 1 to 5, on
matched seeds. At f = 1 the family multiplies the speciation rate by one, which is to
say it has no effect at all: those 200 runs are the null, the same machinery with nothing
to find.
Every genome also carries a second family, called control. It appears at the root and
is lost at the same rate as the driver, but nothing in the simulation depends on it: it
drives no rate, so it cannot make any lineage speciate faster or slower. If its prevalence
still rises in the driven runs, that rise can only come from the shape of the tree, never
from anything the family itself does. The whole sweep is 1,400 joint runs.
What the dependency does to the data
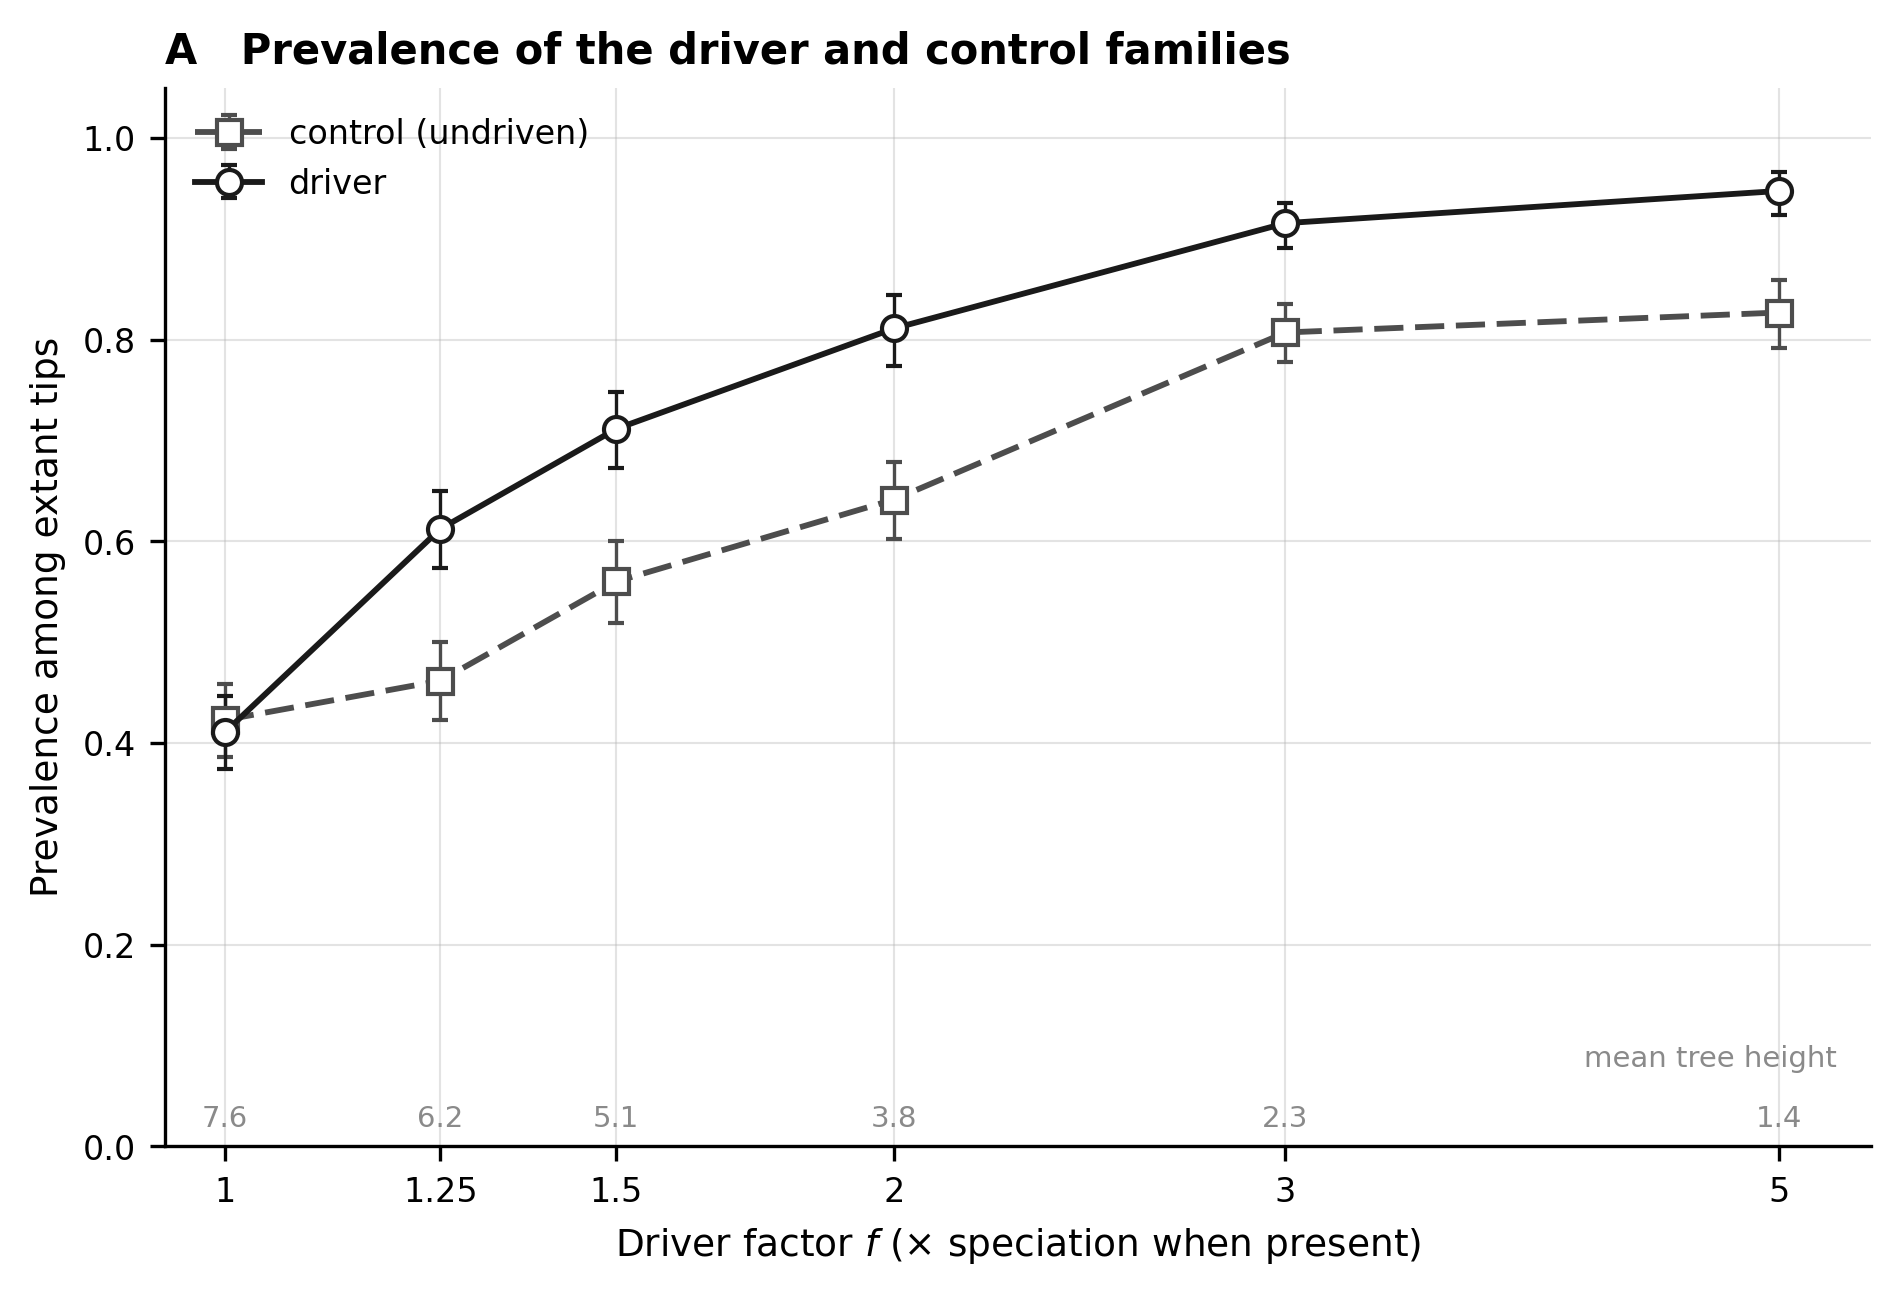
The driver's prevalence among the extant tips rises with the factor, from 0.41 in the null to 0.95 at five-fold (panel A). But the control rises too, from 0.42 to 0.83, with nothing driving it. The reason is the shape of the tree: a driven clade reaches its 150 tips sooner (the mean tree height falls from 7.6 to 1.4 time units), and on a younger tree every family, driven or not, has had less time to be lost.
Because both families sit in the same genomes, the driver's rise splits cleanly into its
two causes. Take f = 3. The control stands at 0.81 against 0.42 in the null runs: a
step of about +0.40 that can only be the younger tree, since nothing drives the control. The
driver stands at 0.92, another +0.11 above the control on the very same trees: that last
step is the only part caused by the driver's effect on speciation, carriers splitting
three times faster and leaving more descendants. An analysis of real genomes would see
only the total rise, with no way to tell the two causes apart; this dataset can, because
it carries its own control.
What BiSSE reports
For every replicate we fit BiSSE with diversitree, exactly as its documentation
recommends, on the driver's tip presence and on the control's: 2,165 fits (an invariant
character cannot be fit, which skipped 235 of the 2,400).
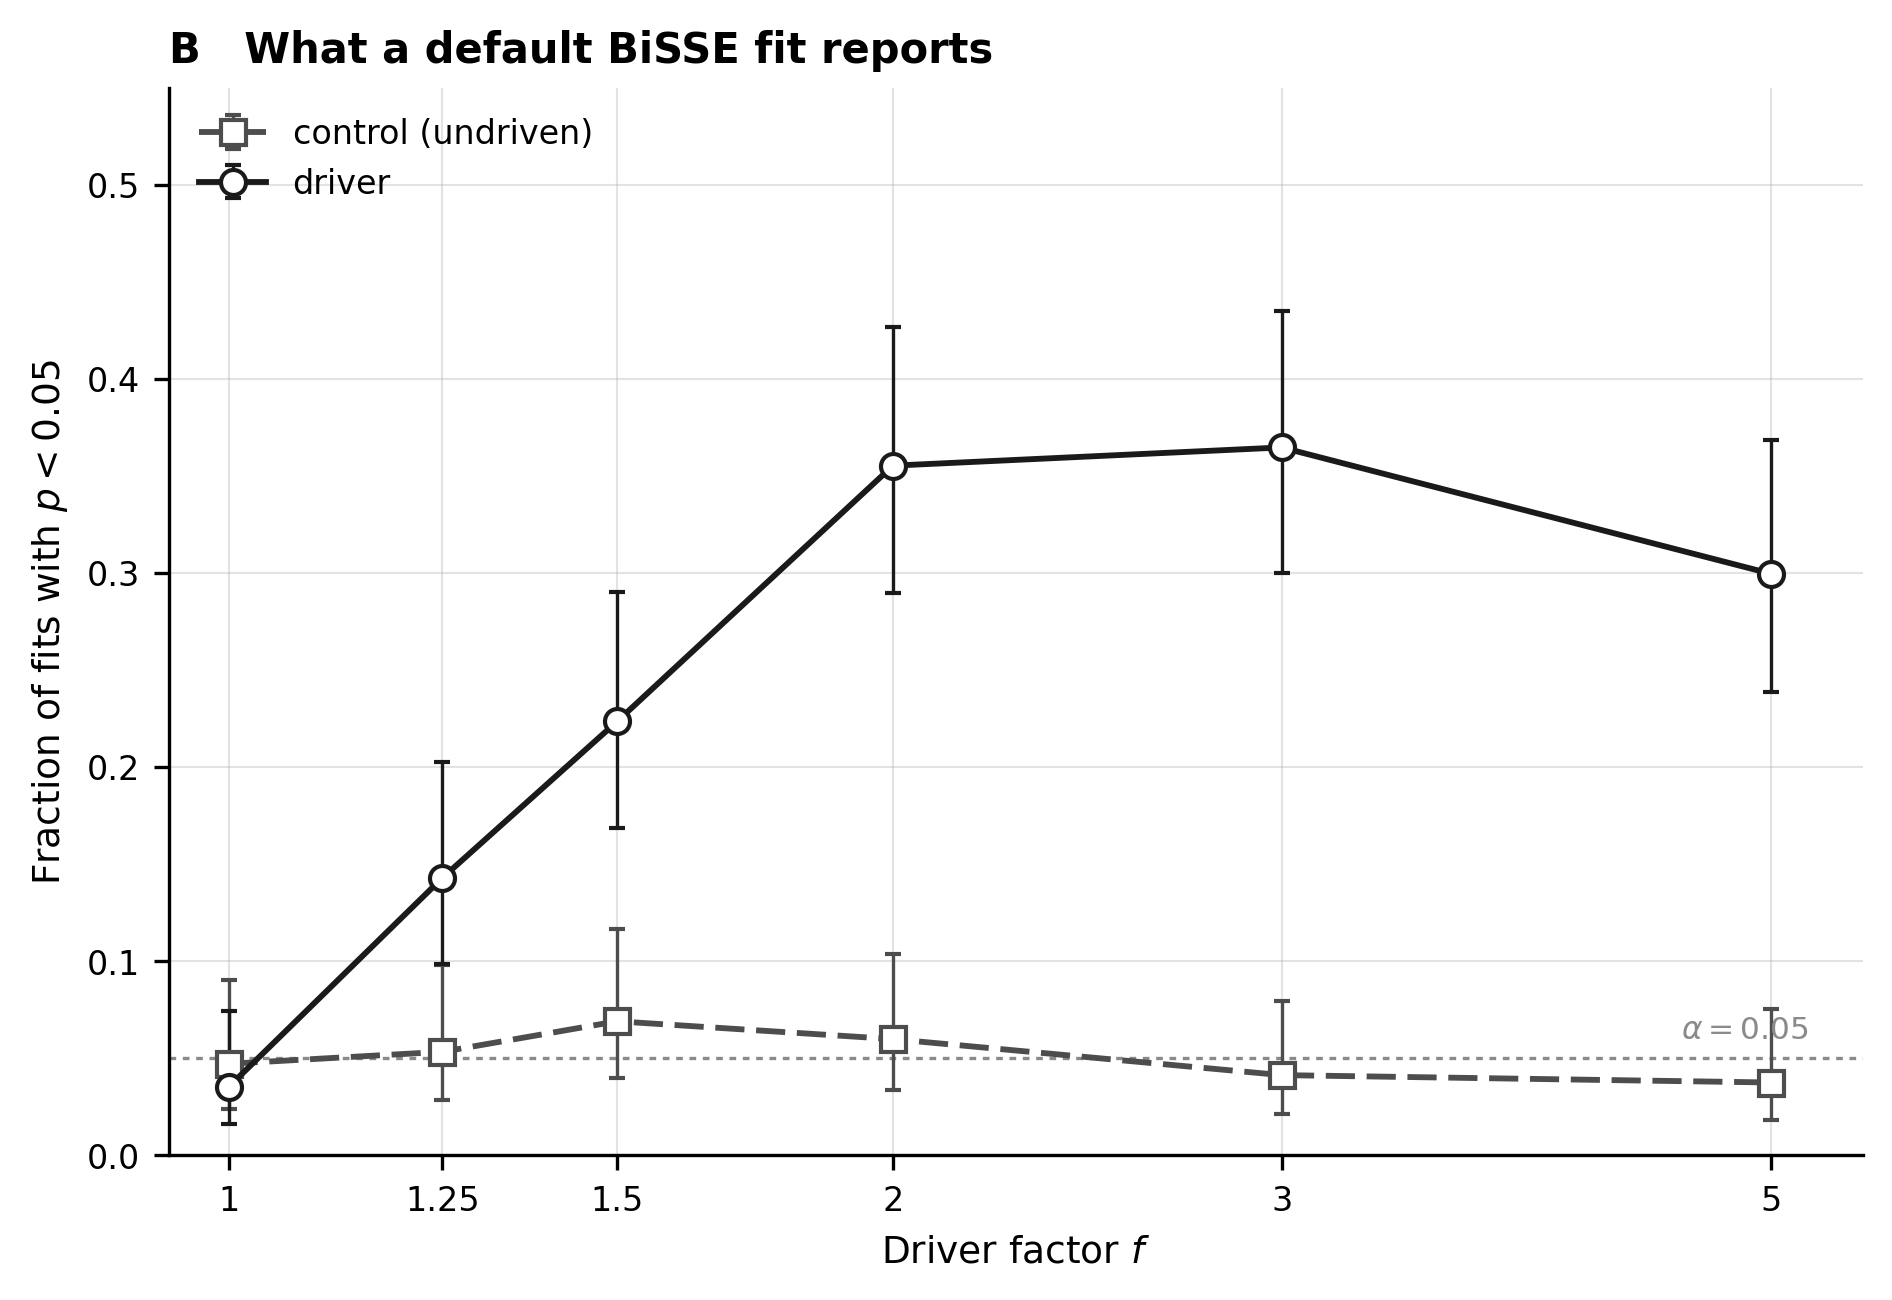
The test is well calibrated here. It rejects on the driver at the null in 3.5% of fits
and on the control in 5.2%, even on the driven trees, whose rate heterogeneity is real
but belongs to the other family. When it rejects at f > 1, it puts the higher
speciation rate on the carrier state in 255 of 256 fits. What limits it is power, and not
monotonically (panel B): a three-fold effect on speciation, enough to move prevalence by
+0.50, is found in 36% of 150-tip clades, and a five-fold effect is found less often,
in 30%, because a stronger driver pushes the family toward fixation and the shorter, more
uniform trees carry fewer of the events the likelihood needs. On data like these the risk
is not the false positive; it is reading a non-significant result as the absence of the
effect.
Does a bigger tree fix it?
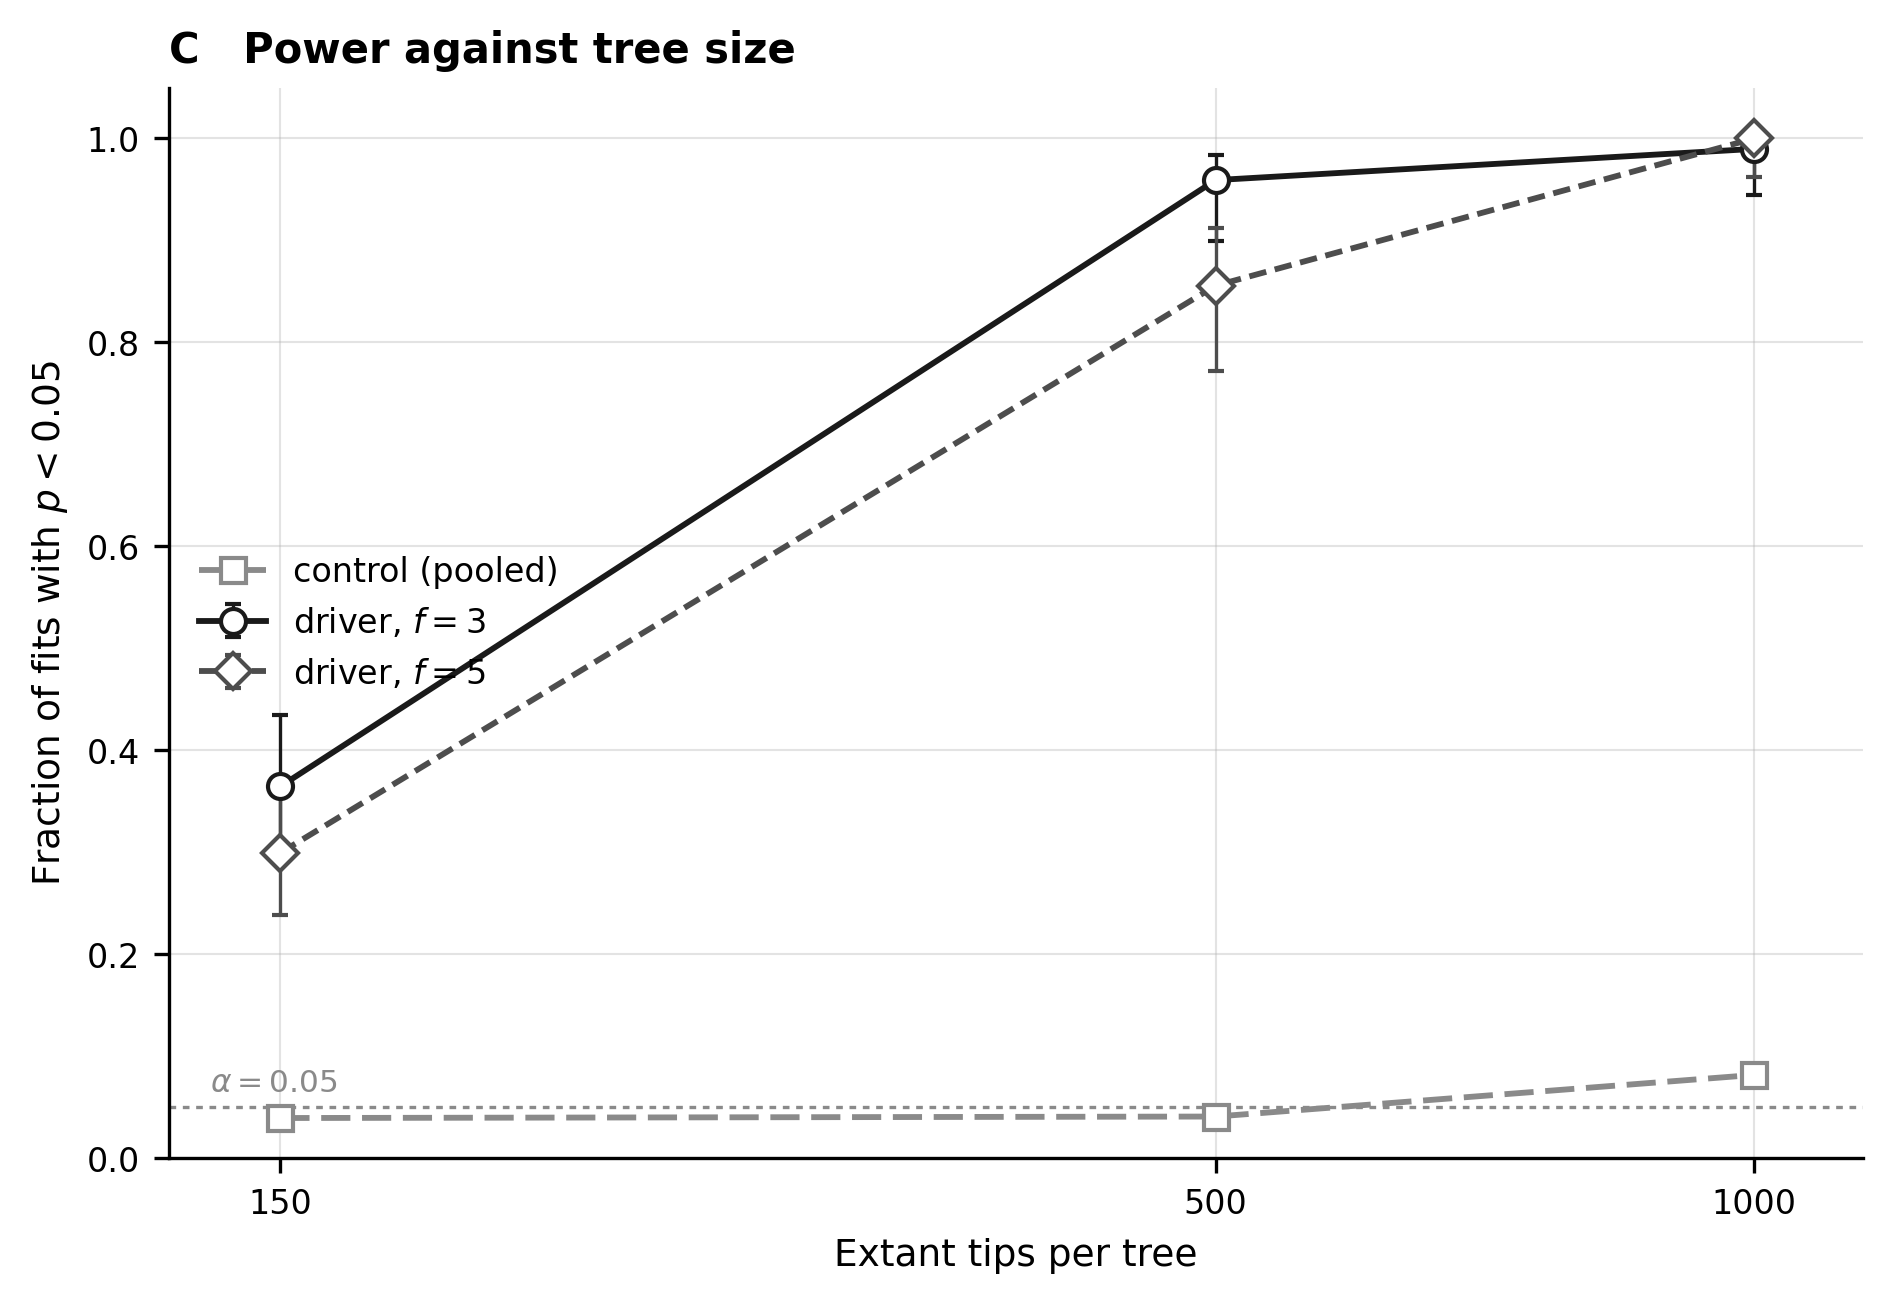
Tree size settles what the 150-tip ceiling was made of. Rerunning the f = 3 and
f = 5 arms at 500 and 1,000 extant tips lifts detection to 96% and 86%, then to 99%
and 100%. So the test does find the gene, given enough tree: the ceiling was information
starvation, and even the five-fold deficit, still there at 500 tips, closes at 1,000.
The catch arrives with size. The control, calibrated at every smaller size, is rejected
in 8% of the 1,000-tip fits, above the nominal 5%. The practical reading: on small trees
a negative result says little, on very large trees a bare positive deserves a second
look, and in between the test behaves.